Semi-Annual Usability Action Report 4.2
Submitted by: CWTSatoTravel ··· July - December 2018 ··· Edition 4.2
Revision History
| Contributor/Author | Edition | Date | Comments |
|---|---|---|---|
| John Utter, Laura Kistler | 1.0 | 07 December 2015 | Initial |
| John Utter, Laura Kistler | 1.1 | 26 January 2016 | Revisions based on PMO feedback |
| John Utter, Laura Kistler | 2.0 | 01 July 2016 | Updated |
| John Utter, Laura Kistler | 2.1 | 02 August 2016 | Revisions based on PMO feedback |
| John Utter, Laura Kistler | 2.2 | 09 January 2017 | Updated |
| John Utter, Laura Kistler | 3.1 | 03 July 2017 | Updated |
| John Utter, Laura Kistler | 3.2 | 15 January 2018 | Updated |
| John Utter, Laura Kistler | 4.1 | 15 July 2018 | Updated |
| John Utter, Laura Kistler | 4.2 | 15 January 2019 | Updated |
Purpose and Overview
The following describes the CW Government Travel., Inc. (d.b.a CWTSatoTravel) Semi-Annual Usability Action Report (SAUAR) for ETS2 E2 Solutions. This document is required by section D.40.hh of the GSA ETS2 Master Contract GS-33-FAA009.
Twice per year, CWTSatoTravel delivers a SAUAR to the PMO within 30 days prior to the Semi-Annual Performance Review. The SAUAR is provided to report on usability and user experience of the ETS2 E2 Solutions product, detailing usability assurance activities during the previous six months, and communicate status and progress of the usability program to ETS2 E2 Solutions system stakeholders. Each SAUAR will describe any changes to key personnel in our cross-functional usability team since the previous SAUAR, provide a summary of any completed system changes or enhancements that are intended to improve usability, as well as any usability or accessibility (e.g., Section 508) audit findings performed during the period of review. Recurring usability indicators — measures of efficiency, effectiveness, web performance and customer satisfaction — as well as the major findings from ongoing usability evaluation activities will be detailed. Known plans to correct or mitigate usability and accessibility issues will be documented in the SAUAR in the context of an updated ETS2 E2 Solutions product roadmap.
As specified in D.40.hh, the SAUAR reports on CWTSatoTravel’s disciplined and iterative approach to User-Centered Design (UCD) and Usability Engineering (UE), including but not limited to efforts to complete user-centered design and usability engineering analyses, evaluations/tests, corrective actions to mitigate identified usability problems, and/or upgrades. The Semi-Annual Usability Action Report shall provide updates on the following:
-
Changes in key Contractor ETS2 UCD/UE team personnel;
-
Overview of any user interface design changes or enhancements;
-
Documentation of the findings from any Accessibility Audits or other Section 508 compliance activities, including any corrective actions planned or completed;
-
Updates to any recurring usability indicators being tracked on a semi-annual basis in keeping with the Contractor’s User-Centered Design/Usability Assurance Plan, such as:
-
Efficiency indicators, such as:
- Time taken by users to complete ETS2 tasks (such as those specified in ETS2 Use Cases)
- Time taken by users to complete end-to-end ETS2 transactional processes
- Time taken by users to access online help information
-
Effectiveness indicators, such as:
- User rates of completing ETS2 tasks
- User rates of abandoning tasks
- Various errors or types of errors
-
Satisfaction indicators, such as:
- Analysis of comments and questionnaire data from Usability Tests
- Customer satisfaction survey data
- User focus group and/or interview data
-
-
Documentation of the findings from any usability evaluation activities undertaken in the preceding six months, such as:
- Usability audits based on inspection by qualified usability professionals
- Task-based usability testing with representative users attempting typical ETS2 tasks
- Observations of users in their work environment
- User customer satisfaction surveys
- Analysis and reviews of click-stream web logs, including error conditions, online help access incidents, and task times and completion/abandonment data
- Analysis and reviews of Help Desk incidents logged as usability issues
- Feedback gleaned from user during ETS2 training
-
Contractor progress in mitigating identified usability issues in relation to the Contractor’s software development life cycle, release schedule, and Technology Refresh plans.
Executive Summary
CWTSatoTravel is committed to incorporating best practices in usability improvement, user-centered design, and usability engineering into the ETS2 E2 Solutions software development lifecycle and service delivery. These practices are part of our usability-centered continuous improvement program, involving iterative and ongoing usability improvement activities. Our goals are measurable continual improvements to the efficiency, effectiveness, and satisfaction levels of the ETS2 E2 Solutions product and service. The period of performance (POP) of this SAUAR is July 1 – December 31, 2018. During this POP, the E2 Solutions team continues to focus resources on agency implementations and enhancements, development of new features and functionalities, and expanding usability assurance activities. Key points within these areas:
- There have been no changes to key UCD/UE personnel;
- Several changes have been implemented to improve usability within E2 Solutions and the online booking engine (GetThere);
- The restructured E2 Solutions User Interface continues to have both significantly increased the amount of work completed per user session, in significantly reduced time;
- CWTSatoTravel continued collaboration following data and guidance learned from the GSA’s ETSNext initiative;
- GetThere and CWTSatoTravel completed 15 remote user interviews from multiple agencies focusing on OBE hotel attachment, quick book, and expenses;
- CWTSatoTravel completed 1 remote and 8 in-person TAVS user interviews with State users and admins in October. A third in-person session was scheduled with USAID, however, all but one intended traveler became unavailable so the session was canceled;
- E2 Solutions continues development and testing to meet WCAG 2.0 AA success criteria under the Revised Section 508 Standards;
- Migration of web analytics from Adobe SiteCatalyst to Google Analytics. Expected completion is R2019.2;
- Information architecture evaluations and prototype redevelopment of Mobile Shop First and User Profile is underway.
Contractor ETS2 UCD/UE Team Key Personnel Updates
Key Personnel
During this reporting period, there were no changes to key personnel as identified in the ETS2 Master Contract on the E2 Solutions UCD/UE team:
- John Utter, Usability Assurance Manager (UAM)
- Ann Reubish, Service Technical Lead
- Laura Kistler, Director, Products & Services Marketing
UCD/UE Cross-functional Team
The UCD/UE team consists of a cross-section of E2 Solutions team members from Quality Assurance, Product Support, Development, and Business Analysis. The UCD/UE team continues to work with our third-party vendors, GetThere, our online booking tool provider, and Oracle RightNow Technologies (RNT), our help desk issue tracking tool, to ensure usability issues with their products are documented and addressed.
Participation in usability efforts extends beyond the UCD/UE team. Program Managers, Trainers, Help Desk Analysts, Business Analysts, Developers, Quality Assurance Analysts, and Product Owners support usability improvements in their departments. CWTSatoTravel has specific teams within these groups focused on usability efforts, as does GetThere. Our UAM “runs point,” and reports to the director-level. The UAM and directors work across teams to drive usability and accessibility improvements across product lines, teams, partners, and subcontractors.
Usability testing is proctored at agencies by the UAM, supported by other employees and partners. These cross-functional groups gain deep insight by speaking directly with users of the software they create. The UAM designs these sessions to be a high-growth opportunity and welcomes the GSA’s participation also.
- CY2016 — in-person testing was conducted by the UAM, Director, Trainers, Program Managers, and GetThere representative.
- CY2017 — the UAM, Director, Software Development Manager, Senior Business Analyst, and Senior Product Director executed in-person and remote UX evaluations during the POP. GetThere representatives also attended and executed UX evaluations.
- CY2018 — in-person and remote testing was conducted by the UAM, Director, Program Managers, Senior Business Analyst, QA Manager and GetThere; focused on users at major and minor agencies new to participating in evaluations.
Overview of Major User Interface Design Changes or Enhancements
During this period of performance, CWTSatoTravel supported multiple product releases for both E2 Solutions and from our online booking solution provider GetThere. A summary of these releases is shown in Table 1.
Table 1 - Product Release Summary
| Type | Number | Date |
|---|---|---|
| E2 Solutions | 18.3 | September 2018 |
| E2 Solutions | 18.3.1 Patch | October 2018 |
| E2 Solutions | 18.4 | December 2018 |
| GetThere | 18.07 | June 2018 |
| GetThere | 18.08 | August 2018 |
| GetThere | 18.09 | August 2018 |
| GetThere | 18.10 | September 2018 |
| GetThere | 18.11 | December 2018 |
While these releases included many changes to the E2 Solutions software to support new functionality and defect resolution, several changes were introduced that will have a positive impact on the user experience targeted to meet goals of the ETSNext initiative, including:
- Reduces time in the system
- Reduces task complexity
- Improves user confidence in the system
- Improves user communication and direction
- Encourages policy compliance
- Simplifies managing travel
Table 2 provides a list of notable items, along with their associated release and a general description of the expected impact. Details for each item are described in the remainder of this section.
Table 2 – List of Major Usability Improvements
| Item ID | Release | Summary | ETSNext Category | Impact |
|---|---|---|---|---|
| Multiple | E2 Solutions 18.3, 18.4 | Restructured E2 Solutions User Interface | Reduces task complexity Improves user confidence in the system |
Simplifies and modernizes TAVS user interface and page style, for page clarity and user focus. |
| Multiple | E2 Solutions 18.3, 18.4 | Updates to conform to Web Content Accessibility Guidelines (WCAG) 2.0 AA | Reduces time in the system Reduces task complexity Improves user confidence in the system |
Accessibility remediation progress to meet Section 508 Refresh success criteria and make the application more usable to all users of E2 Solutions. |
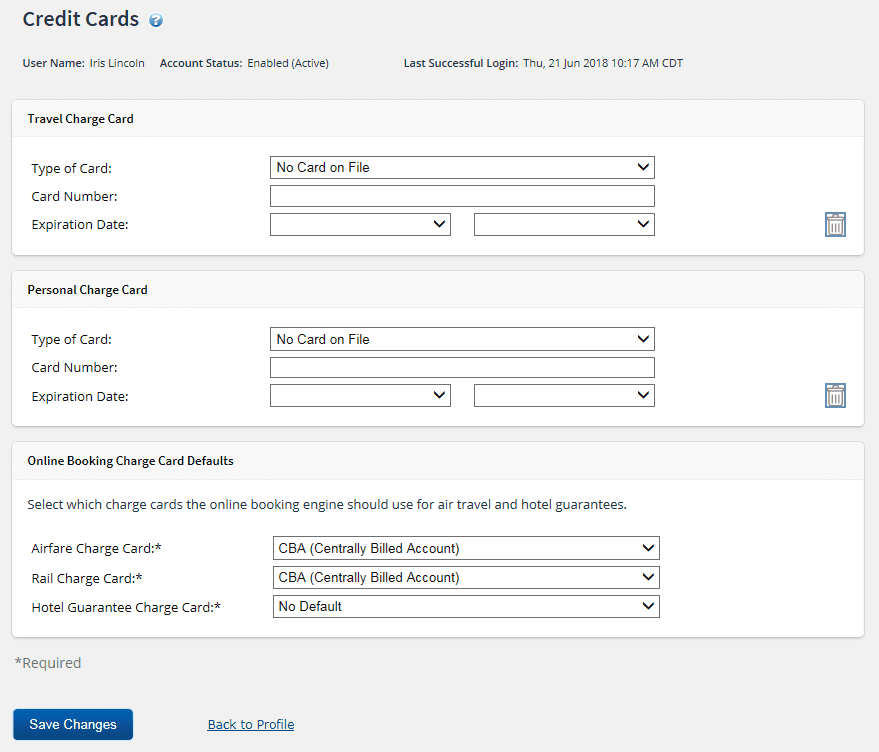
| US13051 | E2 Solutions 18.3 | Updated Credit Cards Page | Reduces task complexity | The Credit Cards page was enhanced to allow users to more easily add and maintain credit card information associated with their E2 user profile. |
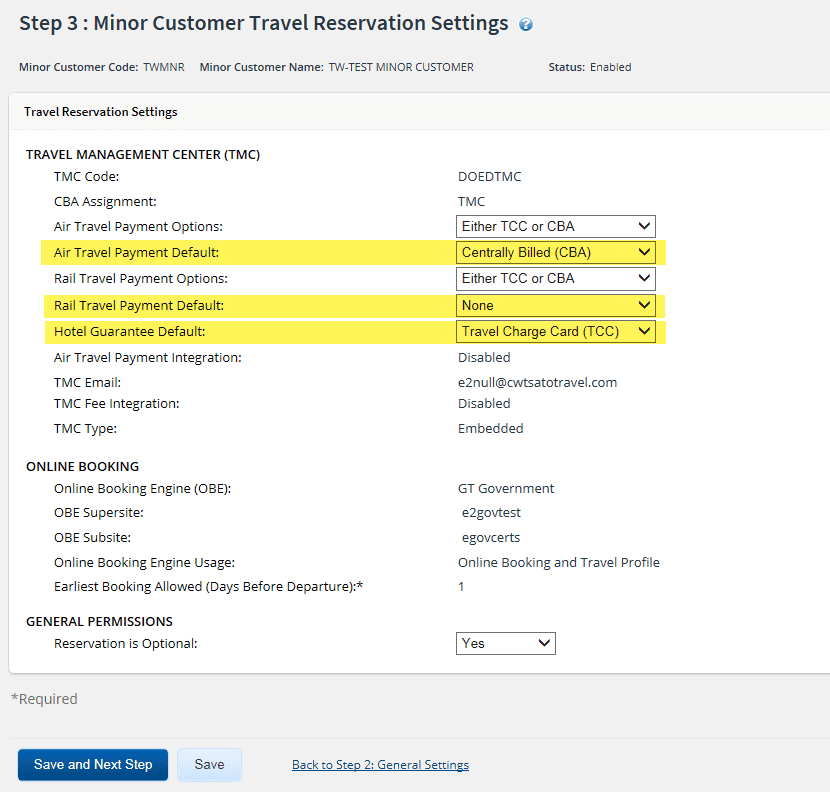
| Multiple | E2 Solutions 18.3 | Default Forms of Payment | Reduces task complexity Encourages policy compliance |
Default forms of payment, at the minor customer level, automatically applied to the profile of all new users. As part of this feature, messaging feedback will be provided based on the configuration of the minor customer settings, traveler profile, and user settings. |
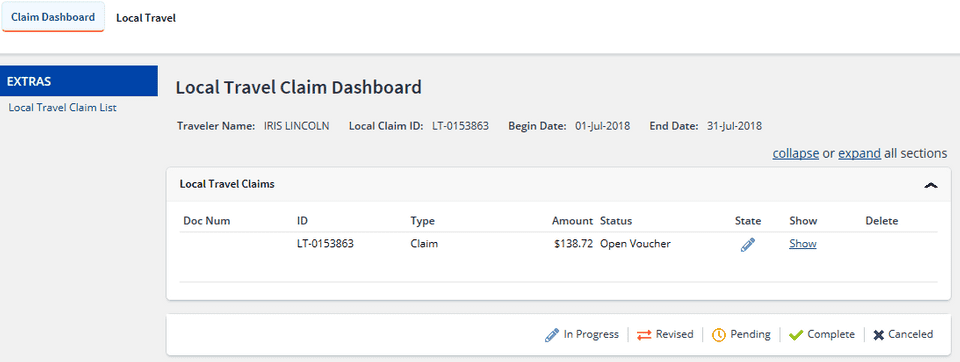
| Multiple | E2 Solutions 18.3 | Local Travel Claim Dashboard | Simplifies managing travel | A dashboard is now available for local travel claims. |
| Multiple | E2 Solutions 18.4 | Change/Disable Approver | Simplifies managing travel Reduces task complexity |
An administrator can now disable an approver or change the User Type field from Approver to Traveler or Auditor, even if the approver is a member of a routing pool. |
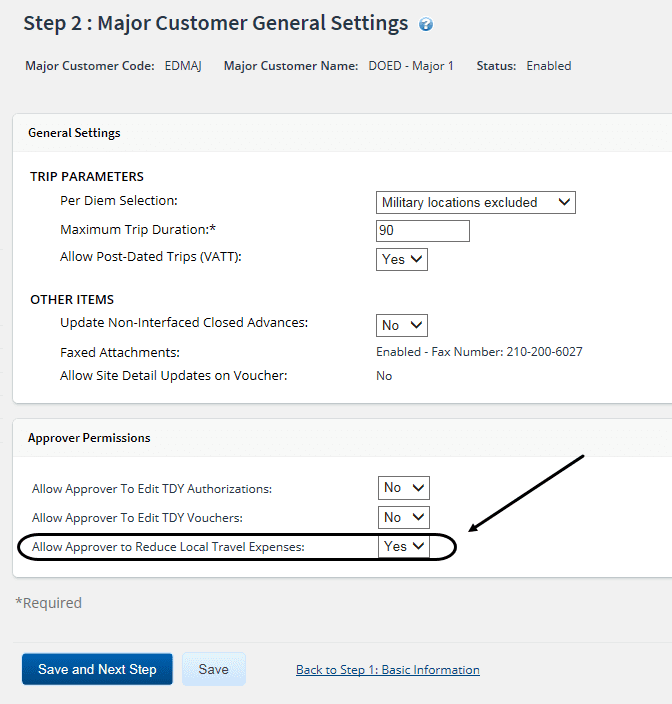
| Multiple | E2 Solutions 18.4 | Local Travel Reduce Expenses | Simplifies managing travel Encourages policy compliance |
Department of State requested the ability for approvers to reduce expenses on a local travel voucher pending approval, similar to the ability today for TDY vouchers. The goal is to expedite payment to the traveler. |
| Multiple | E2 Solutions 18.4 | Report Scheduling | Simplifies managing travel | Report Scheduling is a new feature in E2 Solutions that allows you to schedule a report from the E2 Reports library or the Ad Hoc Reporting repository to run unattended and automatically, according to a predefined schedule. |
| TD49231 | GetThere 18.07 | Government airfares | Encourages policy compliance | Government fares were not being pulled into GetThere when they were available in the GDS. |
| N/A | GetThere 18.11 | Air Shopping Enhancements | Improves user communication and direction Reduces task complexity |
Updates were made to the online booking tool (OBT) to improve the air shopping experience. Travelers using the “Search by price” feature will now follow a workflow similar to the “Search by time” process, but still be able to make selections based on price and review the ultimate price of the trip. |
Restructured E2 Solutions User Interface
Documented in detail in Release Notes and previous SAUAR, the E2 Solutions team is continuing on a modernization effort to update the E2 Solutions user interface. The changes are focused on how information is presented while preserving the baseline content and workflow. Our goals for the user interface include:
- Reduce screen “noise” and declutter the workflow.
- More cohesive integration between the travel and expense application and the online booking tool.
- Meet Revised Section 508 Refresh accessibility standards in effect January 18, 2018 for all new functionality.
The updated UI was first made available by feature flag in March 2018; Agency customers could turn on the new look when they were ready. All Agencies migrated automatically in the fall of 2018. The investments in clear and consistent UI and fast application response appear to return gains in user-work completed in significantly reduced time. Measurable task results information can be found in Efficiency.
Section 508 Refresh — Web Content Accessibility Guidelines (WCAG) 2.0 AA
E2 Solutions continues to make updates to conform to Web Content Accessibility Guidelines (WCAG) 2.0 AA success criteria. These updates enhance accessibility to Information and Communication Technology (ICT) for people with disabilities and meet the revised Section 508 standards (published 18 January 2017).
Updated Credit Cards Page
The Credit Cards page, accessed via the User Profile, was simplified to allow users to more easily add and maintain credit card information associated with their E2 user profile. If you need to modify the information for a travel or personal charge card that was previously added to your profile, simply enter or select the new information in the appropriate section.
Default Forms of Payment
Enhancements were made in 18.3 to allow you to establish a default form of payment, at the minor customer level, for hotel guarantees, as well as the default forms of payment to be used for airfare and rail charges when the minor customer allows both a centrally billed account (CBA) and travel charge card (TCC) as valid payment options. These default forms of payment, if selected, will be automatically applied to the profile of all new users created in E2 Solutions.
As part of this feature, messaging feedback will be provided to users based on the configuration of the minor customer settings, traveler profile, and user settings.
Local Travel Claim Dashboard
A dashboard is now available for local travel claims. After you have completed the first step in the local travel claim workflow and saved the document so that a claim ID is assigned, if you exit the workflow and then access the local travel claim again, a tabbed interface displays. The Claim Dashboard tab allows you to view the local travel claim and any additional documents associated with the claim, as well as execute specific actions, while the Local Travel tab allows you to access the workflow and maintain the actual claim.
Change/Disable Approver
An administrator can now disable an approver or change the User Type field from Approver to Traveler or Auditor, even if the approver is a member of a routing pool. Currently, the administrator must remove the approver from any pools prior to performing this action.
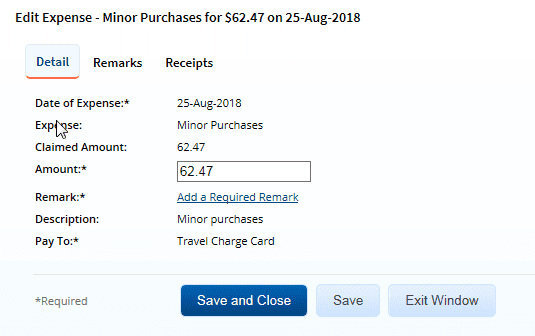
Approver Edit Expense Window
When the Allow Approver to Reduce Local Travel Expenses field for the major customer is set, the Edit Expense window will be editable, and an approver will be allowed to reduce the amount of an expense and still approve the claim.
Report Scheduling
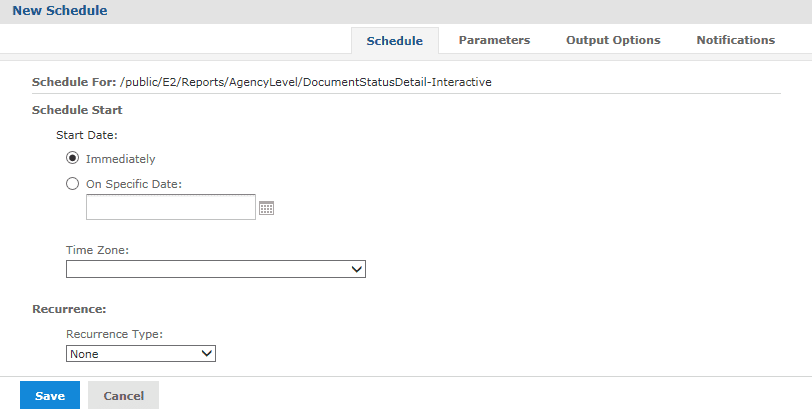
Report Scheduling is a new feature in E2 Solutions that allows you to schedule a report from the E2 Reports library or the Ad Hoc Reporting repository to run unattended and automatically, according to a predefined schedule.
For those users with the Report Scheduling check box checked, right-click on the report you want to schedule, and then select Schedule from the context menu. This displays the Scheduled Jobs page.
Air Shopping Enhancements
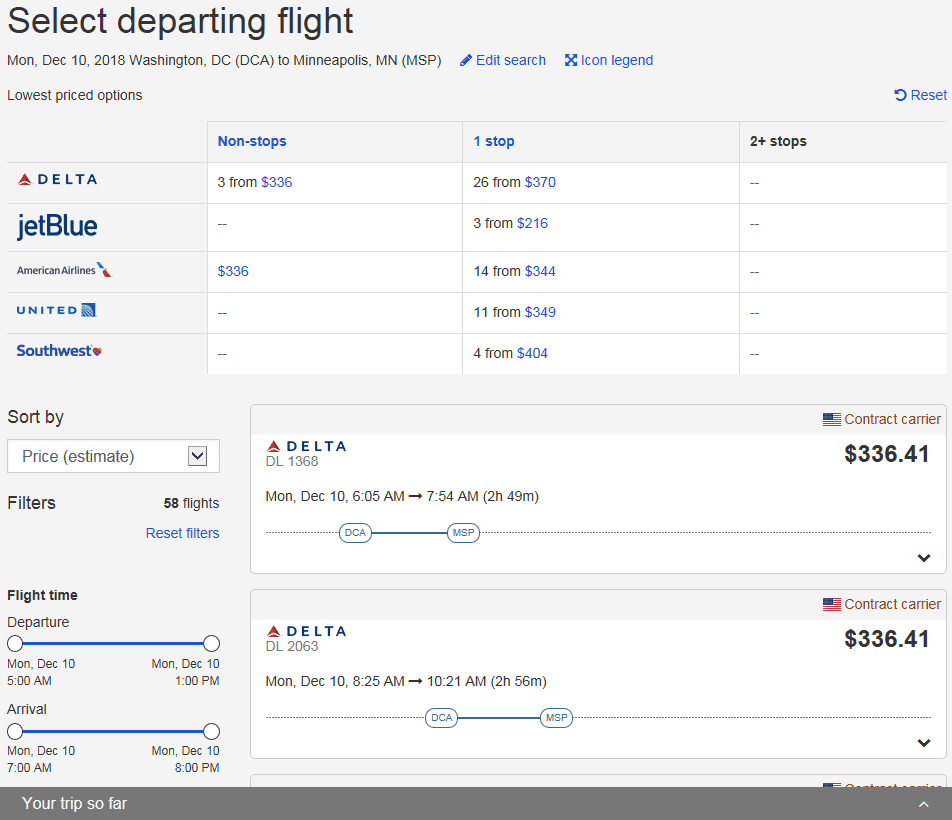
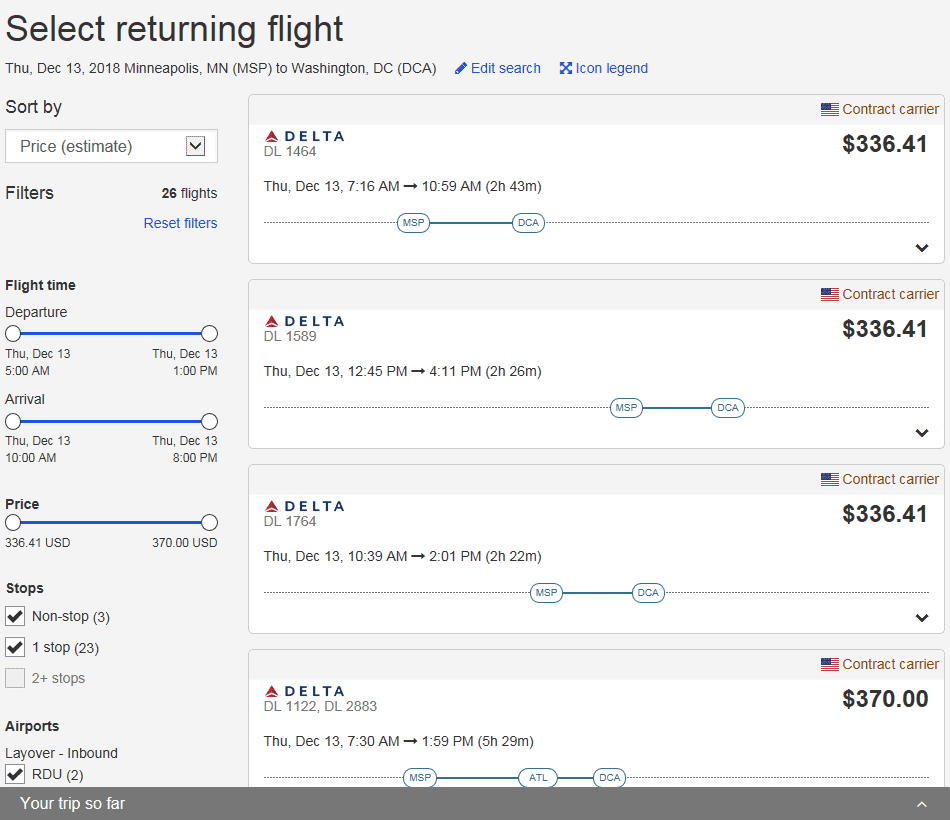
When you search by price, instead of seeing departure and return flight pairs in a single list in the search results, users will now be taken to the Select Departing Flight page. Unlike the “Search by time” process, however, the pricing matrix still appears at the top of the page, and the amount shown on the flight card is indicative of the total price for that departure flight and the lowest possible return flight.
After a departing flight is selected, the user is taken to the Select Returning Flight page. The amount shown on each flight card indicates the total price of the trip, based on the selected departure flight and that particular return flight. After a return flight is selected, the user continues through the typical OBT workflow.
Upcoming Usability Improvement Activities
As of publication, upcoming usability improvement activities include:
TAVS
- Implement short-term usability improvements such as those identified in the ETSNext roadmap
- Continue collaboration with the GSA’s ETSNext Program recommendations
- Encourage the adoption of agency-configurable settings that may result in usability improvements
- Expand metrics recording and segmentation within Google Analytics
- Develop incremental usability improvements resulting from usability indicators and user evaluations
- Perform CY2019 remote or in-person user testing with agency end user pool
- Resolve remaining UI Refresh user stories
- Improve reporting on error condition tracking and recovery. View Error Conditions section in this SAUAR.
- Participate and help guide tech refresh
- Promote progressive development of the user interface and task flow
OBE
- Continue to drive usability improvements to the GetThere online booking engine
- Improve hotel attachment rate
- Reduce the time it takes to book reservations
CWTSato To Go
- Communicate to agencies that accessibility remediation is complete
- Review VPATs
- Promote mobile app capabilities
Recurring Usability Indicators
Usability has an international standard definition in ISO 9241 pt. 11 (ISO, 1998), which defined usability as the ”extent to which a product can be used by specified users to achieve specified goals with effectiveness, efficiency, and satisfaction in a specified context of use.” We further define software usability in terms of the following attributes:
1. Efficiency
- Time taken to complete critical tasks
- Time taken to complete end-to-end processes
- Time taken by users to access online help information for critical areas
2. Effectiveness
- User rates of completing critical tasks
- User rates of abandoning critical tasks
- Rates and types of errors
3. Satisfaction
- Analysis and comments and questionnaire data from usability tests
- Analysis of customer satisfaction survey data
- Analysis of user focus group and interview data
4. Performance
- Front-end website performance
- Browser incompatibilities and bottlenecks
- Page rendering and performance
- User’s perceived site performance
These attributes provide comprehensive measurable ways to assess the usability of the ETS2 E2 Solutions product. Usability tests contain some combination of completion rates, errors, task times, task-level satisfaction, test-level satisfaction, help access, and lists of usability problems including frequency and severity.
There are generally two types of usability tests:
-
Formative tests — discovering and fixing usability problems. The bulk of E2 Solutions’ usability testing is formative. It is often a small-sample qualitative activity where the data takes the form of problem descriptions to inform design recommendations and development priority. Users are provided scenarios or tasks that are not specific, and for the user resolve in the way they prefer.
-
Summative tests — measuring the usability of an application using metrics. Users are provided detailed scenarios or tasks and the usability of the application can be quantitatively measured by counting user errors or deviations from optimal path.
CWTSatoTravel usability reporting metrics of the ETS2 E2 Solutions product include feedback sources such as the self-audit, UX evaluations, help desk logs, and customer discussions that include training sessions, focus and user groups.
Efficiency
Web analytic tools capture meaningful information regarding E2 Solutions usage at scale. In order to accurately gauge system usability, our team measures and tracks subjective usability indicators and benchmarks over time, and across different user roles. These indicators include web analytic data generated by production E2 Solutions system usage. Configuration to capture more complete usability indicators from these tools began collecting data in production with the 16.4 release. In addition to efficiency metrics discussed elsewhere in this report, other metrics of interest observed during POP include:
-
Currently the average unique role user visits E2 Solutions:
- Traveler — 2-3 times per month
- Approver — 6-8 times per month
- Auditor — 8-15 times per month
- Admin — 2-5 times per month
-
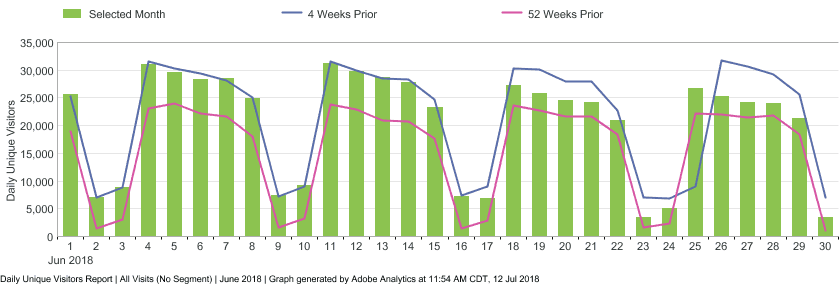
Across user roles, ~28,941 weekday uniques (18% increase since last SAUAR) visited 31.54 pages per session (15% increase since last SAUAR). Increased user activity likely from a cleaner UI, advancing familiarity with workflow process and gains related to page response times from front-end optimization. Users may complete multiple workflow tasks within one session.
-
Travelers completed their tasks on average of 29:19 minutes, about a 14.6 minute improvement (~33% faster than last SAUAR). This data is referencing the user’s session. More specific end-to-end task workflow metrics are included within the SAUAR, such as average task completion and fallout for authorizations, vouchers and local vouchers.
-
Recent investments in clear and consistent UI and fast application response appears to return remarkable gains in user-work completed in significantly reduced time.
-
Over the month of June 2018, the 14.6 minutes task reduction average among 450,138 traveler logins is the equivalent of 109,533 workhours saved compared to pre-UI Refresh travelers (October 2017).
-
Users checking a document status and then exiting accounted for about 24-30% of site traffic . We are exploring methods to better communicate document status to these users.
-
E2 Solutions is continuing to see significant returns in user efficiency, with ~15% more pages viewed per session in ~30% less time.
June 2018 (UI Refresh):
| User Role | Unique Visitors | Visits | Page Views | Average Time on Site | Average Page Depth | |||
|---|---|---|---|---|---|---|---|---|
| Traveler | 176,244 | 71.2% | 450,138 | 54.2% | 5,646,211 | 50.5% | 00:29:19 | 30.94 |
| Approver | 80,821 | 32.6% | 390,302 | 47.0% | 5,483,783 | 49.0% | 00:28:00 | 31.68 |
| Auditor | 175 | 0.1% | 1,370 | 0.2% | 39,549 | 0.4% | 01:05:23 | 93.93 |
| Admin | 405 | 0.2% | 964 | 0.1% | 12,702 | 0.1% | 00:28:47 | 47.21 |
| Total | 247,644 | 831,244 | 11,182,245 | 00:28:46 | 31.54 |
October 2017 (FEO, legacy comparison):
| User Role | Unique Visitors | Visits | Page Views | Average Time on Site | Average Page Depth | |||
|---|---|---|---|---|---|---|---|---|
| Traveler | 146,273 | 73.3% | 424,275 | 56.3% | 5,702,230 | 51.9% | 00:43:54 | 24.18 |
| Approver | 57,976 | 29.0% | 334,244 | 44.3% | 5,218,205 | 47.5% | 00:39:06 | 30.56 |
| Auditor | 97 | 0.0% | 1,238 | 0.2% | 41,711 | 0.4% | 01:22:30 | 57.91 |
| Admin | 217 | 0.1% | 1,068 | 0.1% | 15,464 | 0.1% | 00:38:57 | 43.73 |
| Total | 199,594 | 754,227 | 10,977,610 | 00:41:46 | 27.37 |
June 2017 (legacy comparison):
| User Role | Unique Visitor | Visits | Page Views | Average Time on Site | Average Page Depth | |||
|---|---|---|---|---|---|---|---|---|
| Traveler | 97,593 | 63.5% | 362,540 | 51.4% | 5,498,351 | 50.5% | 00:48:29 | 24.30 |
| Approver | 59,206 | 38.5% | 345,135 | 48.9% | 5,315,651 | 48.9% | 00:40:17 | 28.25 |
| Auditor | 112 | 0.1% | 1,784 | 0.3% | 49,239 | 0.5% | 01:15:35 | 52.14 |
| Admin | 165 | 0.1% | 958 | 0.1% | 13,742 | 0.1% | 00:40:46 | 47.65 |
| Total | 153,712 | 705,174 | 10,877,160 | 00:44:32 | 26.39 |
Mobile Users
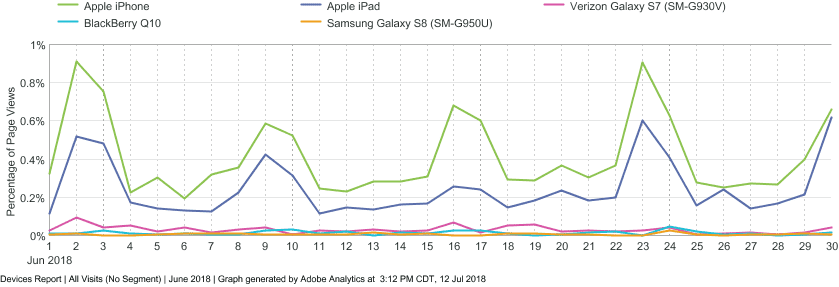
- Mobile users remain iOS-centric. E2 Solutions receives about 75% mobile users from iOS platforms.
- Mobile use of TAVS continues to spike on weekends and holidays when typically away from the office. E2 users would appear to accept a mobile-first TAVS and further UI refinement to benefit mobile users.
Effectiveness
CWTSatoTravel and GetThere may evaluate the effectiveness of E2 Solutions application during the POP of this report with User Experience Evaluations. User Evaluation info and results can be found under Usability Audits.
User fallout, exit pages and abandons are discussed in Completion Data, Task Conversion and Abandonment Data.
User Satisfaction — ETS2 Customer Satisfaction Survey Results
GSA conducted the ETS2 Customer Satisfaction Survey using standardized SUS questions, receiving 3,704 responses. Full results were delivered during this POP and extensively discussed with internal stakeholders.
-
E2 Solutions 2018 Contract Score of 69.38 (up 2%) is a modest improvement upon 2017’s 68.03.
-
Since 2017, GSA determines the contract score as the average sum of all survey respondent’s answers to the 20 Likert-scored questions. All are weighted equally, the results of the Overall Satisfaction question has been shown to be significantly higher than the contract score. Users can be generally unsatisfied with some part of the support, itinerary, policy, or reimbursement but satisfied with the overall product or service.
-
The survey unfortunately was closed days before the UI Refresh was pushed to Production. CWTSatoTravel expects a larger bump in 2019.
-
Our UCD/UE team, development, business stakeholders and partners carefully read and categorized every open-ended user comments to weight and guide usability improvement efforts.
-
Survey data was imported into Data Studio for CWTSatoTravel BAs to more easily get aggregate info about their major/minor agency customers.
-
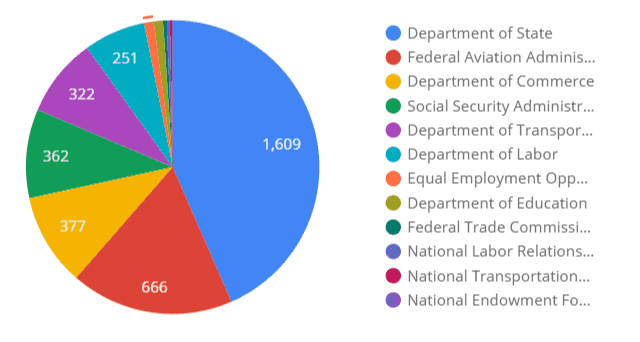
We do see that GSA has worked hard to bring the some parity to the respondents. State remains 43.4% of the data, down from 53% in 2017. Respondents relative to an Agency’s voucher transactions continues to highly favor one or two agencies. We request GSA seek increased response from SSA, DoED, DOT, DOC, DOJ, and USSS in 2019.
Tracking Overall User Satisfaction
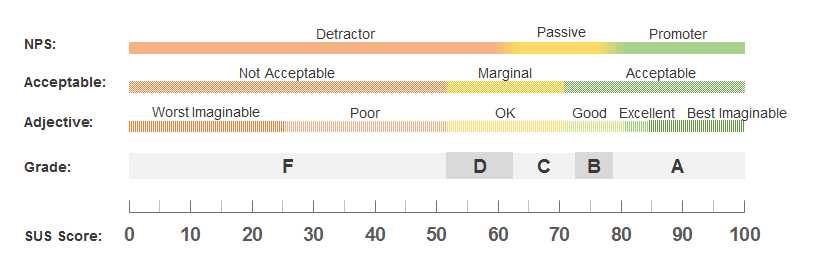
SUS is what Usability.gov recommends for ETS2 monitoring usability metrics over time. E2 Solutions is approaching average SUS: The mean SUS is a 68.
“You’d need to score above an 80.3 to get an A (the top 10% of scores). This is also the point where users are more likely to be recommending the product to a friend. Scoring at the mean score of 68 gets you a C and anything below a 51 is an F (putting you in the bottom 15%).”
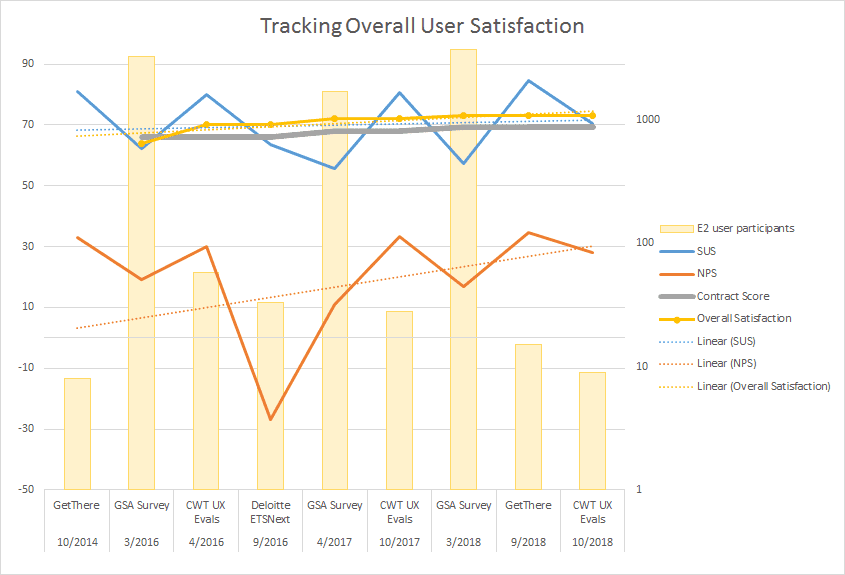
SUS, NPS, GSA Contract Score, and user response to “Overall Satisfaction” survey questions are charted below using available historic data from usability studies and customer satisfaction surveys completed by CWT, GetThere, GSA, and Deloitte to try to visualize related usability scores over time. NPS variance appears more sensitive to user opinion due to a higher weight, lower frequency single question and is simplest to gather from volunteers.
When not surveyed in the respective evaluation, SUS and NPS was estimated using the SUS-NPS regression equation and converter by Jeff Sauro and Jim Lewis at Measuring Usability was used to complete estimates for this graph. The work of Sauro and Lewis are referenced at least three times on usability.gov, including directly from the usability.gov SUS method page. Our Usability Assurance Manager considers SUS and NPS to be somewhat interchangeable. Further, Sauro and Lewis found,
“The percentage of variation in LTR [NPS] explained by SUS was about 7% (corresponding to a statistically significant correlation of about .606). If you have existing SUS scores from usability evaluations, you can use either of these regression equations to estimate LTR, and from those LTR estimates, compute the corresponding estimated NPS.”
Datapoints in bold below are converted estimates, when one or the other was not available or measured in the particular survey. For future data collection, it is a small effort to collect ratings of NPS in addition to the SUS rather than estimating it, as NPS consists of one single question. It is not practical to gather SUS results with users from prior user evaluations. Where appropriate during future usability examinations, UAM will include the 10 SUS statements within exit-question surveys.
| Date | Event | SUS | NPS | Contract Score | Overall Satisfaction | E2 user participants |
|---|---|---|---|---|---|---|
| Oct-14 | GetThere | 81 | 33 | 8 | ||
| Mar-16 | GSA Survey | 62 ¹ | 19.2 | 66 | 64 | 3246 |
| Apr-16 | CWT UX Evals | 80.1 | 30 | 66 | 70 | 58 |
| Sep-16 | Deloitte ETSNext | 63.5 | -27.0 | 66 | 70 | 33 |
| Apr-17 | GSA Survey | 55.7 | 11.0 | 68.03 | 72 | 1716 |
| Oct-17 | CWT UX Evals | 80.8 | 33.3 | 68.03 | 72 | 28 |
| Mar-18 | GSA Survey | 57.2 | 17.0 | 69.38 | 73 | 3704 |
| Sep-18 | GetThere | 84.7 | 34.5 | 69.38 | 73 | 15 |
| Oct-18 | CWT UX Evals | 70.6 | 28.2 | 69.38 | 73 | 9 |
\¹ SUS questions were not asked in Mar-16. This result is converted estimate from the answers to ”Q7. How satisfied are you with the look and feel of E2 Solutions?”
Performance
CWTSatoTravel measures and monitors system performance on a recurring basis to diagnose and prevent impacts to the user community.
Server Response Time Monitoring
CWTSatoTravel conducts a synthetic test (i.e., a robotic process vs. end user data) on web page response times for key steps within the E2 Solutions application workflow as a gauge of system performance. These tests provide a measure of performance independent of factors outside of our control, such as the user’s bandwidth and network latency. CWTSatoTravel monitors the results of these tests to determine if action needs to be taken to address any system performance issues that may negatively impact the user experience with E2 Solutions.
Non-maintenance performance events during the POP:
-
July 6, 2018 at 09:16AM to 2:20PM CT Traveler attempting to create travel preferences for the first time is receiving a message stating; ”Sorry, a profile could not be created at this time.” GetThere rolled back an SSL update which caused issues connecting between OBE and TAVS to resolve.
-
July 27, 2018 at 10:21AM to 6:22PM CT E2 Solutions identified an issue where users were unable to log in to the Production environment.
-
August 8, 2018 10:26AM to 11AM CT E2 Solutions identified an issue where users were experiencing slowness and intermittent issue in the Production environment.
-
September 4, 2018 7:15AM to 9AM CT E2 Solutions identified an issue where users were experiencing slowness and unable to log in to the Production environment.
-
September 11, 2018 6:05PM to September 12, 2018 9AM CT Several issues have been reported where the user is receiving a “white screen” when attempting to make or change a reservation. In most cases, upon refreshing the browser, the user is able to continue with the online reservations process.
-
September 13, 2018 9:10AM to 10:08AM CT Production environment was experiencing slower than normal performance.
-
September 14, 2018 E2 Solutions has identified an issue where individual changes to a travel charge card are not being updated in the online booking travel profile. Travelers impacted by this issue may experience “charge card errors” or delays in ticket issuance if the charge card data has not been synchronized.
-
December 14, 2018 Some Production environment sessions after successfully logging in are being automatically logged out.
For detailed information, please see E2 Solutions Notification alert emails.
Front-end Optimization (FEO)
Measuring and reporting front-end web performance helps deliver a productive and fast experience. Complex web applications like E2 Solutions and modern browsers have multifaceted interaction, such as ajax, lazyloading, preloading, async-loading, caching, and responsive design that tailor the application’s user experience. Modern web interfaces are getting heavier and heavier, the median payload for desktop sites is now over 1.8MB analyzing HTTPArchive.org data. The E2 Solutions interface is designed and coded to avoid this trend and keep the application snappy and fast.
CWTSatoTravel continues to expand the awareness and scope of front-end optimization system performance testing and data collection program. The goal is to observe web metrics to give developers and operations staff better awareness and insight into what users are experiencing and to track front-end optimization results over time.
CWTSatoTravel tracks how design and code changes impact what users see and how quickly they see it on mobile, tablet and desktop. Site waterfall reports, page load time and total download size, network bandwidth utilization, HTTP headers and front-end performance issues are examined and placed into Test Director for resolution (e.g., combine external styles and scripts, leverage browser and proxy caching).
Real-world network waterfalls between common unprimed- and primed-cache browsers that access E2 Solutions have been discussed in previous SAUARs.
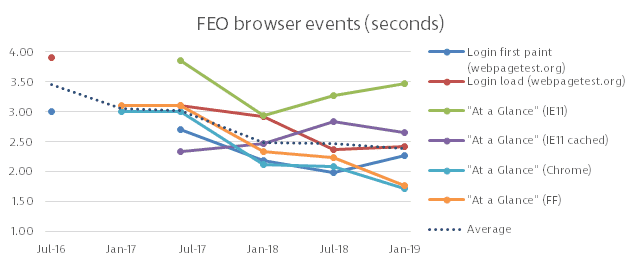
What follows is tracking of “first paint” and “load” events on common pages across release cycles, hardware and software performance improvements, browsers, and cache status.
FEO Observations
-
The IE11 JavaScript engine is not robust which penalizes real-world site speed and responsiveness. JavaScript files also download and execute sequentially in IE, not in parallel as in other browsers. CWTSatoTravel observes users migrating away from IE11 as Agency IT policy allows for browser choice.
-
Users returning to E2 Solutions within 30 days should have all UI-necessary external images, styles, and JavaScript files cached — unless they have cleared their browser cache.
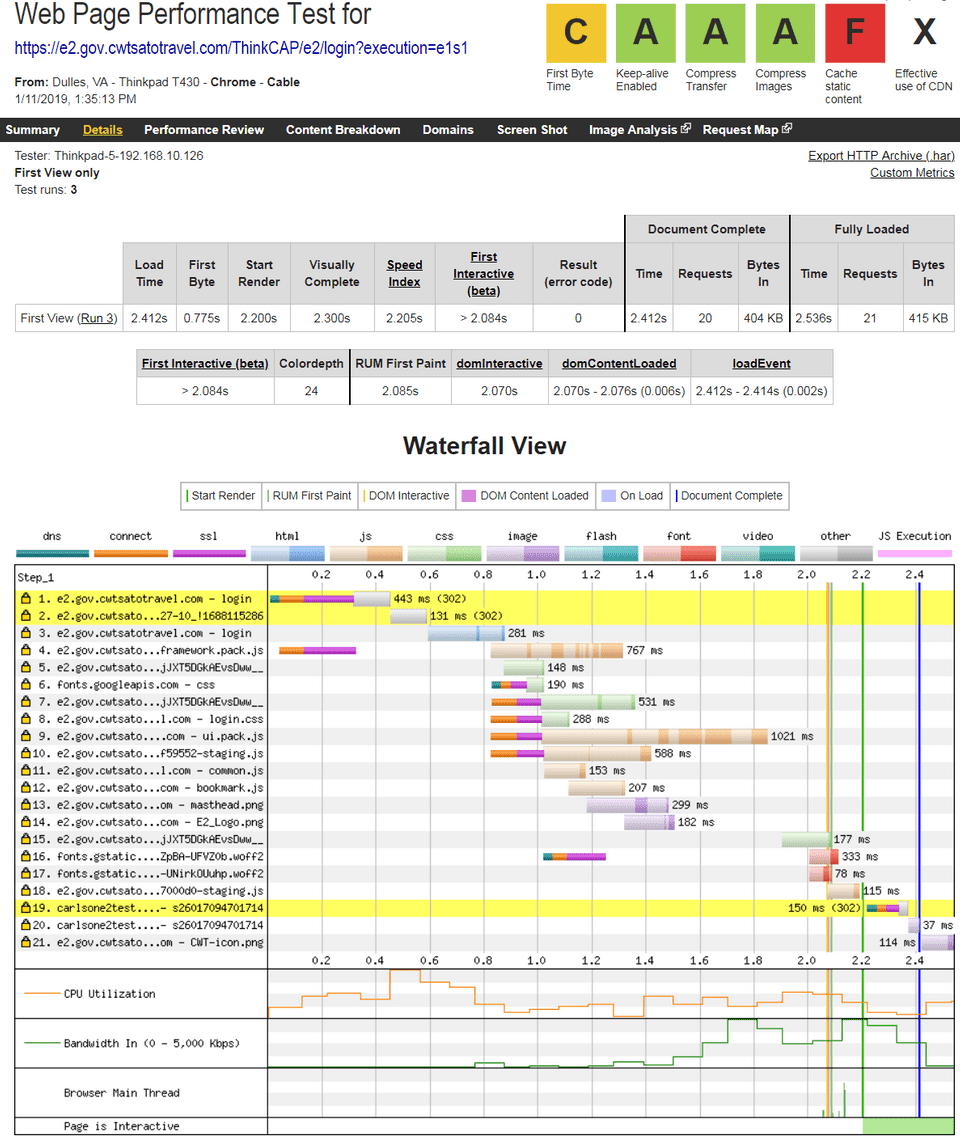
Google Lighthouse dashboard results: unprimed cache desktop browser audit of https://e2.gov.cwtsatotravel.com/ThinkCAP/e2/login?execution=e1s1
Findings from Usability Evaluations
Usability & Accessibility Audits
- An accessibility audit of the CWTSato To Go mobile app for Android was performed. Findings were provided to the mobile application development team for remediation.
Individual Interviews
CWTStatoTravel and GetThere performed individual user interviews with 24 users during the POP. In individual interviews, interviewers talk with one user for 30 minutes to an hour face-to-face, by phone or video conference, or via instant messaging system. Individual interviews probe user attitudes, beliefs, desires, and experiences to get a deep understanding of the user’s task needs and challenges using E2 Solutions. Users may also be asked to rate or rank their choices for site content.
-
GetThere and CWTSatoTravel completed 15 remote 60-minute user interviews from 12 agencies focusing on OBE hotel attachment, quick book, and expenses in September.
- Interview notes from GetThere and CWTSatoTravel UAM
- Report (PDF 1.6Mb)
- CWTSatoTravel completed 9 in-person 90-minute TAVS user interviews with State users and admins in October.
- Another in-person CWTSatoTravel session was scheduled in October with 5 travelers at USAID, however all but one intended users became unavailable so the session was canceled.
Information Architecture Prototypes & Wireframes
- Online-based information architecture evaluations for Mobile Shop First and User Profile sections are under evaluation with internal stakeholders.
Considerations regarding obtaining federal employee usability study participants
Uncompensated volunteers willing to leave their work tasks to altruistically participate in a study are difficult to find. CWTSatoTravel often arranges to meet federal users at their own work location or building. In the private sector and from government-to-government, it is common to compensate usability study participants for their time, and further for government researchers to compensate public participants. However, there are many issues with private sector compensating federal employees. Usability.gov states: “If your participants are federal employees, you cannot pay them for their time.”
However, the ETS2 Master Contract requires vendors to periodically test representative users:
Section C.3.3.1 2) a. “Periodically conducting usability tests involving representative users. Such testing should occur in conjunction with the Contractor’s software development life cycle, prior to any release that involves changes to the ETS2 user interface;”
E2 Solutions target audience/participants are geographically dispersed, requiring travel for them or the experimenters. Remote testing offers an opportunity to administer testing with a larger and diverse group of people than we might be able to accommodate in any lab environment at a vendor or agency, eliminating both the need for a lab environment and the effect of a lab environment on participants, while accommodating a more diverse groups of participants. Un-moderated testing further allows access to a larger pool of participants not possible with limited proctors. However, administrative or technical blocks from full participation were found to be common with agency users — such as inability to install browser plugins or webinar software due to IT restrictions.
Although agency travelers are requested, in-person interviews often skew towards arrangers and administrators who tend to first hear about the opportunity to provide feedback. Obtaining volunteers representative of the user population and personas for varied testing continues to be a challenge to meeting this Master Contract requirement.
Analysis And Reviews of Click-Stream Web Logs, Including Error Conditions, online Help Access Incidents, and Task Times and Completion/Abandonment Data
Error Conditions
Document error rate is as important to understand as the average time of document completion; our goal is to reduce both. CWTSatoTravel seeks opportunity to expand methods of tracking and reporting key tasks for which there is a linear path to “complete” the task, and report on common workflow tasks that can be tracked over time. Error conditions may occur at page level, server level, or task and document level and consideration to reporting scope is necessary. Server, document and task errors are well tracked and UAM is looking at methods to track and report page-level errors, such as form and input user error, in E2 Solutions’ web analytics package.
Task error rate of users testing prototype interfaces are commonly gathered in UX evaluations. Errors observed when completing tasks through user evaluations is extensively reported in previous SAUARs or usability session results presentations. Error rate evaluations guide redevelopment efforts and help measure the impact of improvements.
Online help access incidents
E2 Solutions online help software, the E2 Knowledge Portal, is built upon Oracle RightNow Technologies.
Top 20 Complex Help Page Topics
The following are the top 20 help page topics that caused a user to start a chat session or send an email to a help desk analyst. This indicates sections of E2 Solutions where users may need additional assistance, or that the help documentation for that section needs to improve user communication and direction.
| Answer ID | Summary | # Immediate Ask a Question | # Ask a Question | # Immediate Chats | # Chats | Total |
|---|---|---|---|---|---|---|
| 4175 | Reservations: Changing reservations | 8 | 28 | 13 | 32 | 81 |
| 3980 | Help for authorization Manage Trip Reservations window | 6 | 18 | 14 | 26 | 64 |
| 3956 | Help for voucher Edit Expense window | 4 | 16 | 4 | 17 | 41 |
| 4053 | Authorizations: Amending an authorization | 1 | 11 | 5 | 18 | 35 |
| 3957 | Help for voucher Lodging Expenses window | 1 | 9 | 5 | 13 | 28 |
| 4070 | Authorizations | Reservations | Vouchers: Cancel trip | 2 | 12 | 2 | 11 | 27 |
| 2870 | Training: Computer Based Tutorials (CBT) | 0 | 12 | 3 | 11 | 26 |
| 2804 | Profile: Update credit card information | 1 | 9 | 5 | 10 | 25 |
| 4069 | Authorizations | Vouchers: Closing a trip / change voucher type to final voucher | 4 | 9 | 2 | 7 | 22 |
| 4117 | Authorization: Delete or cancel authorization | 0 | 8 | 3 | 11 | 22 |
| 3970 | Help for authorization Reservation step | 2 | 6 | 1 | 11 | 20 |
| 4137 | Reservations: Tickets | 2 | 5 | 3 | 8 | 18 |
| 2746 | Profile | Reservations | Troubleshooting: TMC profile ID | 0 | 10 | 0 | 6 | 16 |
| 3943 | Glossary: TMC fee amounts - how to obtain current TMC fees | 1 | 2 | 3 | 10 | 16 |
| 4054 | Voucher: Creating and submitting a voucher | 2 | 3 | 3 | 8 | 16 |
| 1728 | Training and Resource Materials: Find Answers | 2 | 9 | 1 | 3 | 15 |
| 3965 | Help for authorization or advance Account Code Selection window | 0 | 2 | 2 | 10 | 14 |
| 4172 | Authorizations | Vouchers: Change approver / change approval routing for a document | 0 | 4 | 2 | 8 | 14 |
| 3846 | Training: User and Administrator guides, Quick Reference Cards | 0 | 9 | 1 | 3 | 13 |
| 3954 | Help for authorization Lodging Expenses window | 2 | 3 | 2 | 6 | 13 |
| 2811 | Profile: Update travel preferences, such as frequent flyer numbers, seat preferences, meal types, etc. | 1 | 3 | 2 | 5 | 11 |
| 3523 | Reservations: Get a copy of reservation invoice, print invoice, print itinerary | 2 | 3 | 3 | 3 | 11 |
| 3966 | Help for authorization Add New Expense window | 1 | 2 | 1 | 7 | 11 |
| 4032 | Help for Itinerary window | 0 | 2 | 2 | 7 | 11 |
| 4094 | Reservations: Canceling a reservation made using Make Reservations | Canceling a held reservation | Canceling a reservation associated with an authorization | 1 | 5 | 2 | 3 | 11 |
| 4187 | Glossary: Make Reservations | 2 | 5 | 1 | 3 | 11 |
Most visited Help and Documentation topics
The following remain top Help and Documentation Topics by “visit.” Reporting trends among the most used help topics indicate areas of the site where users are having the most difficulty. Each of these topics continue to remain high access and also nearly mirror E2 Solutions’ help desk call topic volume:
- Changing Reservations
- Help for Lodging Expenses
- Creating and Submitting a Voucher
- Help for Remarks
- Manage Trip Reservations
- Login Assistance > Login Instructions / Account Locked
Help and Documentation average duration
The following are the top 20 Help and Documentation Topics and average duration spent on the answer, in seconds. These help indicate the most complex sections of E2 Solutions.
| Answer ID | Summary | Visits | Time on Answer |
|---|---|---|---|
| 1309 | Contact CWTSatoTravel | 14316 | 71.01 |
| 1309 | Help for authorization or advance Account Code Selection window | 3263 | 55.92 |
| 3980 | Help for authorization Manage Trip Reservations window | 1834 | 74.70 |
| 3957 | Help for voucher Lodging Expenses window | 1812 | 78.70 |
| 2870 | Training: Computer Based Tutorials (CBT) | 1760 | 222.25 |
| 4032 | Help for Itinerary window | 1689 | 43.04 |
| 3970 | Help for authorization Reservation step | 1413 | 70.73 |
| 4016 | Help for Remarks window | 1407 | 34.21 |
| 4175 | Reservations: Changing reservations | 1214 | 93.18 |
| 4053 | Authorizations: Amending an authorization | 1116 | 94.44 |
| 4259 | Help for Held Reservations window (appears after selecting Show Held Reservations from the My E2 Trips list) | 1016 | 56.05 |
| 3978 | Help for authorization Search Location window | 948 | 56.35 |
| 3846 | Training: User and Administrator guides, Quick Reference Cards | 922 | 153.25 |
| 3956 | Help for voucher Edit Expense window | 916 | 54.54 |
| 3952 | Help for voucher Trip Level Attachment window | 869 | 44.70 |
| 3954 | Help for authorization Lodging Expenses window | 773 | 73.49 |
| 3976 | Help for voucher Basic Information step | 769 | 71.85 |
| 3958 | Help for voucher Meals and Incidental Expenses window | 756 | 93.85 |
| 3966 | Help for authorization Add New Expense window | 721 | 52.55 |
| 4070 | Authorizations | Reservations | Vouchers: Cancel trip | 678 | 96.43 |
| 2804 | Profile: Update credit card information | 675 | 83.89 |
| 4054 | Voucher: Creating and submitting a voucher | 659 | 104.27 |
| 3975 | Help for authorization Trip Level Attachment window | 649 | 40.82 |
| 1470 | Profile: Changing your password | 602 | 33.12 |
| 3968 | Help for authorization Basic Information step | 576 | 52.55 |
| 3964 | Help for authorization or advance Accounting step | 574 | 59.98 |
| 3994 | Help for local travel claim Account Code Selection window | 546 | 52.52 |
| 4216 | Advances | Authorizations | Local Travel | OAs and GAs | Vouchers - Recall document pending approval | 505 | 91.90 |
Task times
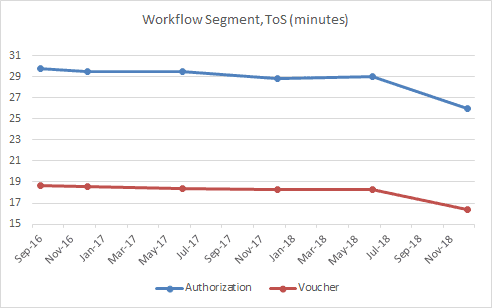
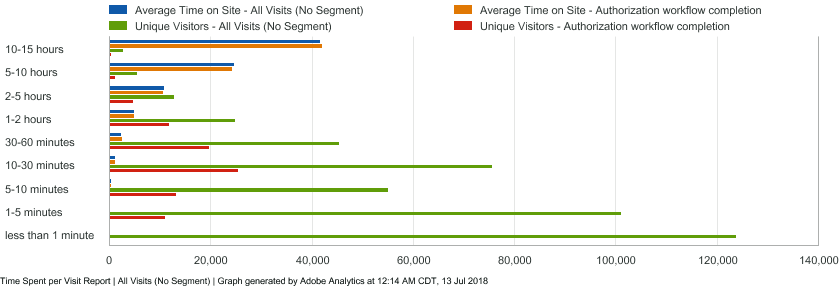
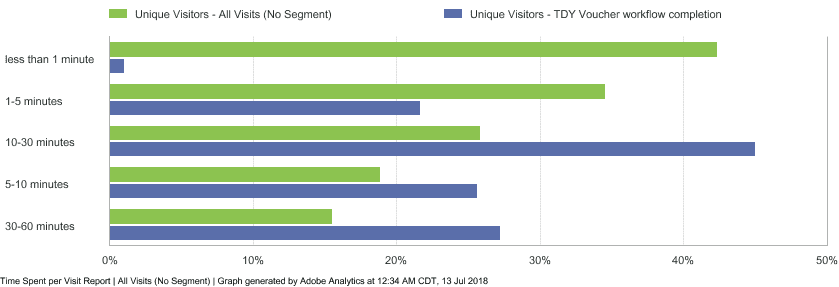
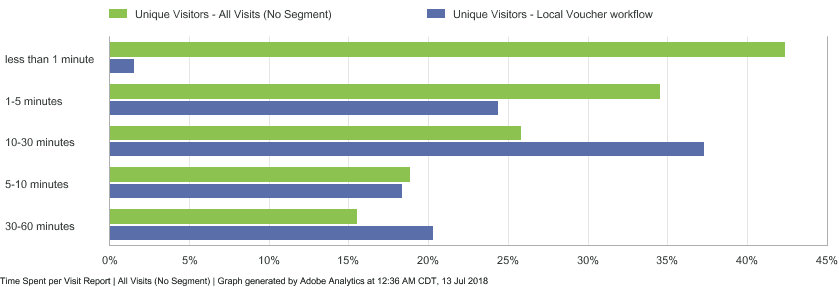
- Average time on site within Authorization and Voucher workflow, removing top and bottom outliers.
- Authorization workflow, details
- Voucher workflow, details
- Local Voucher workflow, details
Completion Data, Task Conversion and Abandonment Data
-
The UCD/UE team continues to investigate the feasibility of reporting metrics around touchless bookings and rejected trips. It should be noted that the touchless rate is dependent on several factors other than usability, including trip complexity and agency policy (e.g., some agencies require all reservations that may result in the exchange of an unused ticket to be booked offline). The rejected document rate is dependent on outside factors as well, such as financial system and funding availability, as well as agency and departmental policy. While it is possible to expand this to a more granular level, it is not a trivial endeavor and reporting that requires development resources is weighted among other usability product improvement efforts.
-
Administrators and auditors, typically more advanced and familiar with E2 Solutions, use the application about twice as efficiently as travelers, and are the most satisfied users of E2.
-
Frequency of use increases satisfaction as is common and expected. Higher number of trips also similarly increases satisfaction. Increased length of use (beyond one year) slightly reduces satisfaction. We have noted this as unusual and sought feedback from users in October to understand assumptions.
-
Across document types, 12-18% of those users exit the workflow while estimating or declaring expenses, a common source of user frustration and area where some users need to complete offline tasks such as gathering their receipts.
-
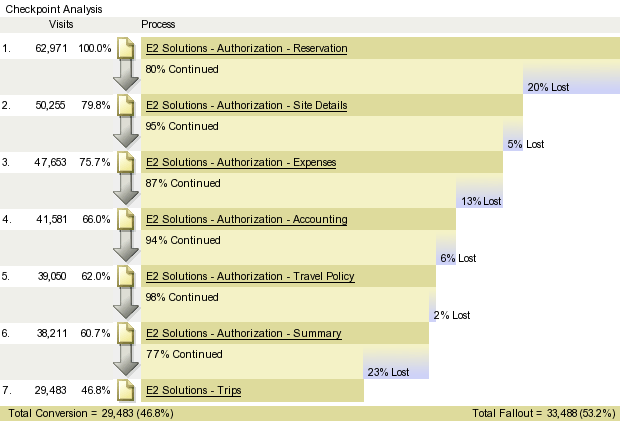
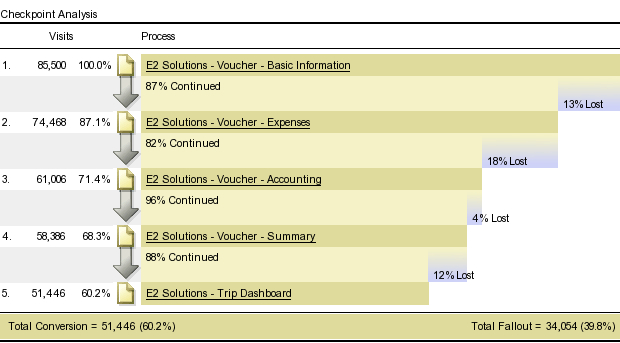
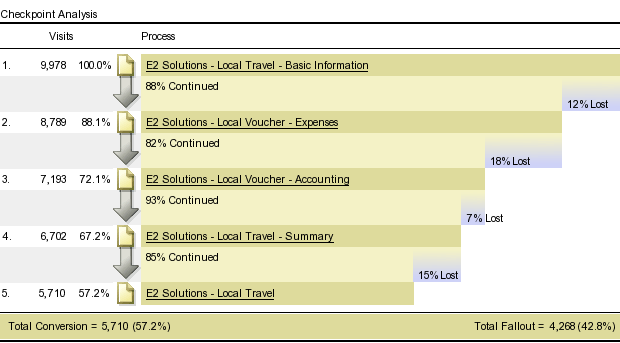
Goal-conversion metrics for Authorizations, Vouchers, and Local Vouchers follow below. Of note:
-
Authorization workflow
- In the Authorization process, ~20-25% of users appear to window-shop: the user leaves the site after creating reservations or returning from the OBE without further completing the Authorization during the session.
- 46.8% of users start their Authorization and submit to an Approver on the first try.
-
Voucher workflow
- 60.2% of users complete their TDY Voucher on the first try.
-
Local Voucher workflow
- 57.2% of users complete their Local Voucher on the first try.
-
E2 Help Desk Incident Reports
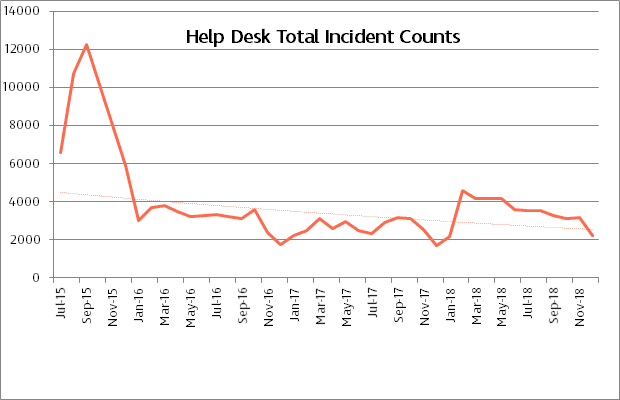
CWTSatoTravel’s E2 Help Desk Incident reports are included in the Appendix. Observations of this information include:
- Calls to unlock user accounts and other login issues have increased and become the highest cumulative call volume. This is expected with the onboarding of new users and is consistent with implementation of new agencies.
| OBE (Online Booking Engine) > Login > Unlock Account | 1,839 |
|---|---|
| Login Assistance > Account locked | 1,436 |
| OBE (Online Booking Engine) > Login > User ID Retrieval | 882 |
-
Assistance with creating or managing reservations continues near the top of caller requests.
-
Most ETS2 end users do not have direct access to CWTSatoTravel’s help desk to log incidents, as they go through their own Agency Tier 1 help desk. This means CWTSatoTravel reports may not contain the majority of “end-user” incidents for ETS2. Overall, the CWTSatoTravel Help Desk total incident counts remains steady, between 2,000 to 4,000 per month.
Feedback gleaned from users during ETS2 training
Task completion rate, time monitoring, and satisfaction were surveyed from attendees of training provided by CWTSatoTravel during the period of this report. Trainers followed the standard practice of documenting any issues identified during training sessions. These issues were evaluated and logged in our defect tracking software where warranted.
- No usability issues were reported to UAM by trainers during this reporting period.
Progress Mitigating Usability Issues in the SDLC
User experience problems (name, description, and severity rating) are stored as common and understandable terms within defect tracking software, Test Director, accessed by CWTSatoTravel’s Customer Service Center, developers, and product support teams.
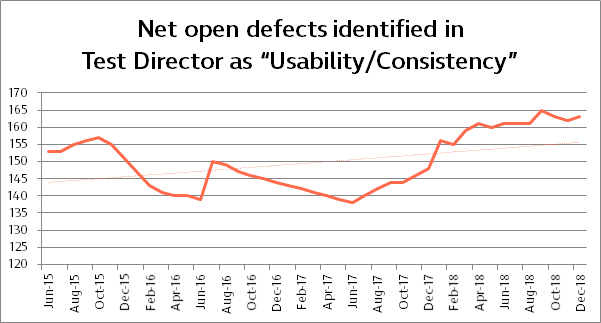
A common technique for assessing the impact of a problem is to assign impact scores according to the severity and occurrences of the problem. What follows is progress resolving defects marked as usability issues in E2 Solutions’ Software Development Lifecycle. These fixes may or may not yet be built into the Production baseline as these counts are reported directly from the Testing and Development Team’s defect tracking software. Following are net counts for remaining open defects identified in Test Director for “Usability/Consistency”:
Unresolved “Usability” or “Consistency” items are classified into the following categories according to our defect prioritization system. No Block issues were reported nor remain unresolved.
| Severity | Net Open Defects | % Total | Severity Description |
|---|---|---|---|
| Trivial | 19 | 12% | Idea, suggestion, or observation that could enhance the overall experience |
| Minor | 91 | 56% | Minor effect on task performance, delays user briefly, cosmetic |
| Major | 54 | 32% | Significant delay or frustration but allows user to complete the task |
| Block | 0 | 0% | Prevents task completion |
| Total | 163 | 100% |
Method of Determining Severity Ratings for Usability Problems
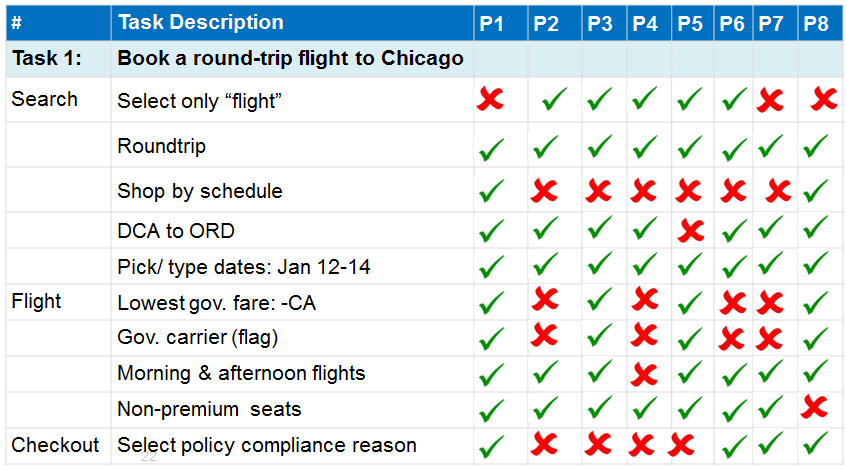
If a user encounters a problem while attempting a task and it can be associated with the interface, it is considered a user interface problem. The usual method for measuring the frequency of occurrence of a problem is to divide the number of occurrences within participants by the number of participants. From an analytical perspective, a useful way to organize UI problems is to associate them with the users who encountered them, as shown in this example of a UI Problem Matrix:
Recording Error Rates
Errors are any unintended action, slip, mistake, or omission a user makes while attempting a task. Error counts can go from 0 (no errors) to dozens. Errors provide excellent diagnostic information on why users are failing tasks and, where possible, are mapped to UI problems. Errors are assigned binary measures: the user either encountered an error (1 = yes) or did not (0 = no).
Task Time
Task time is how long a user spends on an activity. It is most often the amount of time it takes users to successfully complete a predefined task scenario, but it can be total time on a web page or call length and is typically reported as an average. There are several ways of measuring and analyzing task duration:
- Task completion time — time of users who completed the task successfully
- Time until failure — time on task until users give up or complete the task incorrectly
- Total time on task — the total duration of time users spend on a task
Task Satisfaction Ratings
Asking a question on how difficult users thought a task was to confidently complete is valuable when comparing to task completion rates. Even if task completion is at 100%, we also need to understand if users considered the task easy or difficult, and compare that to their expectations. By improving this mean satisfaction rating over time for a particular task one can measure how updated designs improved the user experience. Such subjective measures are especially helpful when evaluating tasks, even those with high “successful” completion rates. For example, a 100% completion rate cannot be improved, but a task that users struggle to complete and thought was difficult can be improved.
Follow-up Single Ease Question (SEQ) post-task questionnaires measure the perception of the ease of use of a system are commonly completed immediately after a task (post-task questionnaires), at the end of a usability session (post-test questionnaires), or outside of a usability test. Here is an example of a post-task survey SEQ:
Determining Combined Scores
In general, users who quickly complete tasks tend to rate tasks as easier. Yet some users fail at tasks and still rate them as being easy, or others complete tasks quickly and report finding them difficult. Although usability metrics often significantly correlate, they don’t correlate strongly enough that one metric can replace another, or stand alone. Reporting on multiple task metrics can be cumbersome over time, so it can be easier to combine metrics into a combined usability score.
Further, combined usability score is a beneficial tool to use with non-design stakeholders. The simplicity and influence of a numerical score helps ensure usability research is digestible and impactful at a glance.
UAM adopted 10-question System Usability Scale (SUS), as well as a simpler metric to collect, the single-question NetPromoter™ (NPS), for tracking and measuring useful overall score(s) for usability in user evaluations or surveys. SUS and NPS have a strong positive correlation and can be used to forecast one another.
System Usability Scale (SUS)
A well-known questionnaire used in user experience research is the System Usability Scale. SUS provides a proven and reliable tool for measuring the usability of an application. It consists of a 10 item questionnaire with five response options for respondents; from strongly agree to strongly disagree. The participant’s scores for each question are added together and then multiplied by 2.5 to convert the original scores to 0-100. Though the scores are 0-100, these are not percentages and should be considered only in terms of their percentile ranking vs. industry peers. The average SUS score (at the 50th percentile) across industries is 68.
NetPromoter (NPS)
NetPromoter™ is a well-established general bellwether even if it’s not as sensitive to UX-focused concerns. NPS is a single question about someone’s likelihood to recommend (LTR) a product: “How likely are you to recommend this product to a friend or colleague?” The response option is an 11-point scale numbered from 0 to 10 with higher numbers indicating higher likelihood to recommend. Promoters are those who choose a 9 or 10, detractors are those who choose anything 6 and below, with the 7-8’s as passive. The “net” in NetPromoter comes from how to score the response. NetPromoter is measured on a -100 to 100 scale. Subtract the percentage of detractors from the percentage of promoters to get the Net Promoter Score.
Periodic Review of User Types, User Tasks, and Use Contexts
It is important for the UCD/UE to periodically review the critical goals of the ETS2 E2 Solutions product to ensure that E2 Solutions’ design and usability features take account of the evolving end-to-end travel process, not only for the needs of government travelers, but also travel arrangers and travel approvers.
Personas
Personas add a real-world dimension when thinking through how users interact with the system, help focus usability design decisions, and test and prioritize features throughout the development process. Information collected from team members, and throughout various usability tests and assessments, can be used to update Persona characteristics, such as personal demographics, professional traits, and technical capabilities. Through the ETSNext initiative, CWTSatoTravel and ETS2 PMO Personas were merged to provide reliable and realistic representations of key users.
Critical User Tasks
Starting with the use cases provided by the ETS2 PMO as a baseline, the ETS2 E2 Solutions Team periodically updates critical user tasks within the ETS2 E2 Solutions application. Once the critical goals of the ETS2 E2 Solutions product are re-assessed, data can be analyzed from usability assessments to determine if critical tasks have changed, added, or become obsolete. This can be performed by periodically asking questions described on usability.gov, such as:
- What will users do when using E2 Solutions? (User tasks, content, features and functionality)
- Which tasks are critical to users’ success on E2 Solutions? (Criticality)
- Which tasks are most important to E2 Solutions users? (Importance)
- Which features of the E2 Solutions will users use the most? (Frequency)
- Which features are prone to usability issues? (Vulnerability)
These questions can be answered against user Personas, as previously described.
Appendix – E2 Help Desk Incident Reports
| Incidents | Jan-June 2017 | Jun-Dec 2017 | Jan-June 2018 | July-Dec 2018 |
|---|---|---|---|---|
| Reservations > Transfer TMC | 1194 | 2832 | 2462 | 2646 |
| Training and Resource Materials > General | 40 | 1893 | 2111 | 1203 |
| OBE (Online Booking Engine) > Login > Unlock Account | 0 | 2141 | 1839 | 1527 |
| Login Assistance > Account locked | 647 | 875 | 1436 | 1164 |
| Profile > Modify Profile | 782 | 1195 | 1318 | 1235 |
| Reservations > Create Reservation | 1188 | 1242 | 1110 | 980 |
| Profile > General | 446 | 1058 | 1109 | 893 |
| Vouchers > General | 758 | 1265 | 1064 | 1114 |
| Reservations > Manage Reservations | 1303 | 1110 | 941 | 879 |
| OBE (Online Booking Engine) > Login > User ID Retrieval | 0 | 1247 | 882 | 983 |
| Reservations > General | 622 | 794 | 878 | 847 |
| Authorizations > General | 635 | 921 | 831 | 606 |
| Authorizations > Create / New | 707 | 854 | 760 | 542 |
| OBE (Online Booking Engine) > Profile > Create/Modify | 0 | 891 | 686 | 771 |
| Authorizations > Amendments | 617 | 906 | 651 | 814 |
| Administration > General | 0 | 673 | 644 | 786 |
| OBE (Travel Reservations) > Helpdesk Assistance > Transfer to TMC | 0 | 905 | 541 | 837 |
| Vouchers > Expenses | 516 | 631 | 485 | 494 |
| E2 Reference > Help and Support > iFind Your Answer | 0 | 638 | 448 | 558 |
| OBE (Online Booking Engine) > Login > Resetting Password | 0 | 538 | 381 | 475 |
| Vouchers > Incremental / Final | 201 | 382 | 353 | 231 |
| Authorizations > Cancel | 324 | 447 | 339 | 319 |
| OBE (Travel Reservations) > Helpdesk Assistance > Reservation | 0 | 521 | 323 | 395 |
| Administration > Administer Users > Initalize/Unlock Users | 0 | 539 | 318 | 485 |
| Login Assistance > Login Instructions | 0 | 22 | 294 | 326 |
| OBE (Online Booking Engine) > Profile Self Registration > Travelers | 0 | 482 | 288 | 568 |
| Reservations > Agent Intervention | 326 | 410 | 275 | 315 |
| Administration > Administer Users > User Setting | 0 | 174 | 218 | 152 |
| Authorizations > Sites | 186 | 237 | 208 | 174 |
| Authorizations > Accounting | 174 | 287 | 207 | 261 |
| Administration > Financial Settings > Financial Rejects | 0 | 215 | 205 | 171 |
| Expenses | 292 | 336 | 190 | 430 |
| Authorizations > Estimated Expenses | 156 | 246 | 184 | 191 |
| Reports > Standard E2 Reports | 0 | 56 | 174 | 163 |
| Authorizations > Approval | 179 | 180 | 146 | 232 |
| Profile > Credit Cards | 127 | 140 | 143 | 94 |
| Approvals | 201 | 136 | 133 | 220 |
| Reservations > Modify Reservation | 147 | 176 | 130 | 145 |
| Reservations > Itinerary/Receipt/Fees | 180 | 141 | 124 | 109 |
| E2 Maintenance > Website Failure | 63 | 139 | 124 | 122 |
| Authorizations > Attachments | 136 | 139 | 112 | 161 |
| Profile > Travel Preferences | 183 | 116 | 94 | 100 |
| Reservations > Cancel Reservation | 116 | 108 | 92 | 91 |
| Workflow Help > Local Travel Claims | 0 | 95 | 90 | 92 |
| Open and Group Authorizations | 81 | 87 | 89 | 71 |
| Administration > Administer Users > Move User to new Minor | 0 | 66 | 89 | 75 |
| Vouchers > Payments | 114 | 164 | 88 | 118 |
| Vouchers > Approval | 65 | 139 | 87 | 87 |
| Vouchers > Supplemental | 96 | 108 | 87 | 92 |
| Profile > Payment Information | 79 | 115 | 82 | 100 |
| CWTSato To Go > Unable to Login | 2 | 66 | 80 | 98 |
| E2 Reference > Help and Support > iAsk A Question | 0 | 52 | 77 | 78 |
| Administration > Approval Routing > Pools | 0 | 89 | 76 | 78 |
| Administration > Approval Routing > Rules/Templates | 0 | 65 | 75 | 79 |
| Reservations > TMC ID | 52 | 81 | 68 | 61 |
| Profile > Favorite Account Codes | 63 | 65 | 61 | 82 |
| E2 Reference > Log in/out | 12 | 37 | 60 | 34 |
| Profile > Approval Routing | 97 | 80 | 59 | 98 |
| Vouchers > Attachments / Receipts | 66 | 64 | 52 | 54 |
| Troubleshooting and Errors | 42 | 47 | 46 | 34 |
| Vouchers > Accounting | 19 | 53 | 43 | 66 |
| Authorizations > Create Reservation | 32 | 59 | 42 | 55 |
| Local Travel Claims > General | 46 | 57 | 42 | 71 |
| Authorizations > Travel Policy | 41 | 61 | 41 | 34 |
| OBE (Travel Reservations) > System Error > Unable to Complete Reservation | 0 | 52 | 41 | 43 |
| Vouchers > Pre-trip | 9 | 15 | 38 | 36 |
| Vouchers > Basic Information | 26 | 47 | 37 | 76 |
| Profile > Arrangers | 40 | 34 | 32 | 44 |
Trademark and Copyright
This document contains trade secret and confidential business or financial information exempt from disclosure under the Freedom of Information Act.

